
Get insights about the performance of your Windows systems with Grafana
Ever dreamed about some mission control like dashboards to get a quick insight about the performance of your Windows systems? 😊
If yes, then you probably like a views like this:
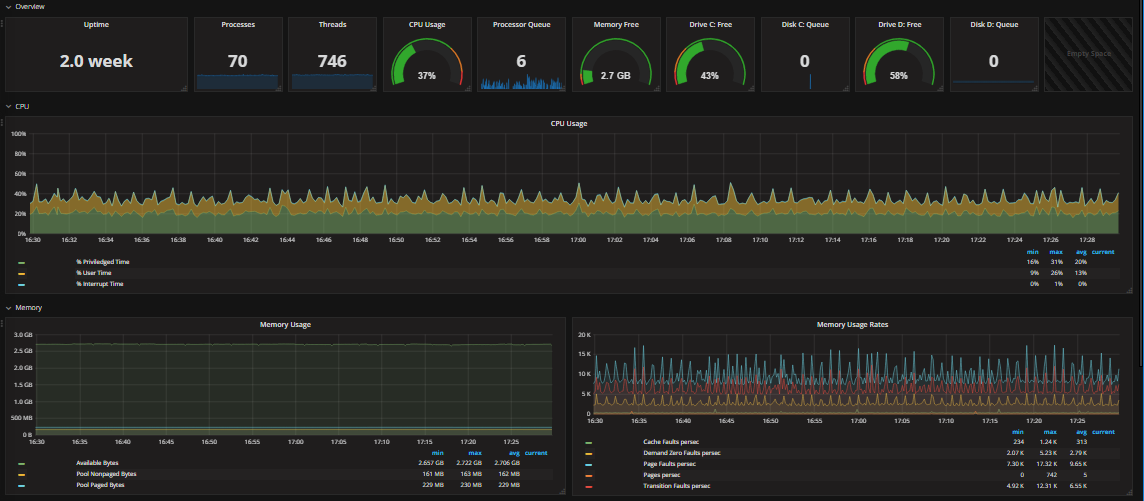
So here is how you get such a dashboard for your system in 6 simple steps in under an hour:
1. Install a VM with Ubuntu Linux 16.04.2 LTS
Even when it is Linux 🐧 and your are not too familiar with, no rocket science is needed here. 😊 Just download the ISO image from the Ubuntu website, attach it to your VM and boot form it. After that you get asked some simple questions about time zone, keyboard and partition settings. The most you can accept with the defaults or choose simple your preferred languages etc. Quite easy.
2. Set time zone to UTC
Login in to your Ubuntu system and change the time zone to UTC. As the InfluxDB (the backend) uses UTC time internally it is a clever idea to set the time zone for the system also to UTC.
To do so run the following command. Then choose “Non of the above” > “UTC”.
sudo dpkg-reconfigure tzdata
3. Install InfluxDB
InfluxDB is the he backend of the solution where all data is stored. It is a database engine which is built form the ground up to store metric data and for doing real-time analytics. To install InfluxDB run the following commands on the Linux VM:
cd /tmp

#download debian package
wget https://dl.influxdata.com/influxdb/releases/influxdb_1.2.2_amd64.deb

#install influxdb package
sudo dpkg -i influxdb_1.2.2_amd64.deb

#start influxdb
sudo systemctl start influxdb

#configure influxdb to automatically start at boot
sudo systemctl enable influxdb</pre>
4. Install Grafana
Grafana is the frontend which will generate your nice-looking dashboard with the data stored in the InfluxDB. To install Grafana run the following commands on the Linux VM:
cd /tmp

#downlaod debian package
wget https://s3-us-west-2.amazonaws.com/grafana-releases/release/grafana_4.2.0_amd64.deb

#install prerequirements and grafana package
sudo apt-get install -y adduser libfontconfig
sudo dpkg -i grafana_4.2.0_amd64.deb

#start grafana server
systemctl daemon-reload
systemctl start grafana-server

#configure grafana server to start automatically at boot
sudo systemctl enable grafana-server.service</pre>
5. Install Telegraf on your Windows system
Now we are ready to collect data from our systems with the Telegraf, a small agent which can collect data from many various sources. One of these source is Windows Perfmon Counters which we will use here.
- Download the latest version of the Windows version of the Telegraf agent https://github.com/influxdata/telegraf/releases
- Copy the content of the zip file to C:\Program Files\telegraf on your systems
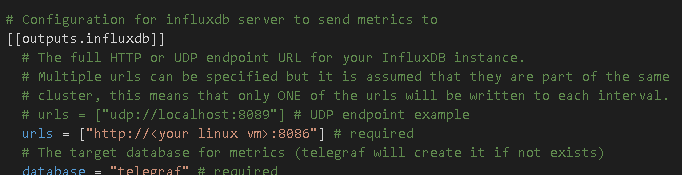
- Replace the telegraf.conf with this one.telegraf.conf
(With this config file all the perform counters get collected which are needed for the example dashboard in the last step.) - Also in the telegraf.conf, update the
urlsparameter so it points to the IP address of your Linux VM
- Install Telegraf as service and start it
cd "C:\Program Files\telegraf\"
telegraf.exe --service install
net start telegraf
6. Create Dahsboards and have fun! 😃
The last step is to create your nice dashboards in the Grafana web UI. A good starting point is the “Telegraf & Influx Windows Host Overview” dashboard which can directly imported from the grafana.net repository. So let’s do that.
-
Login into the Grafana Web UI -> http://
:3000 (Username: admin, Password: admin) -
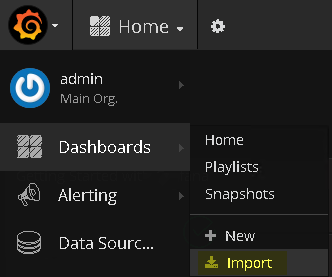
After the first login Grafana needs to know it’s data source. Click on the Grafana logo in the top left corner and select “Data Source” in the menu. Then click on “+ Add data source”.
-
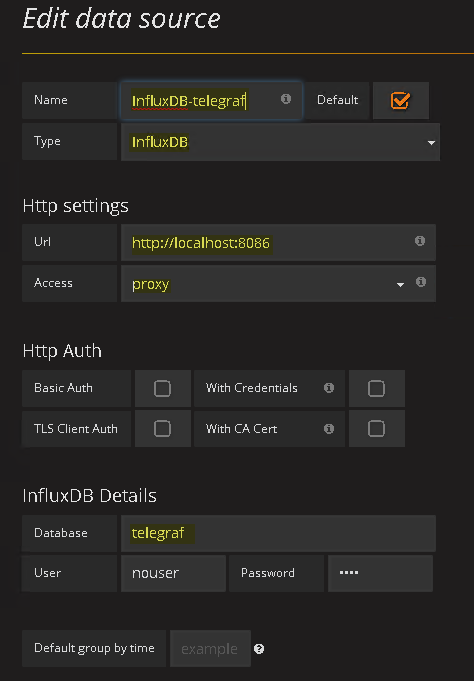
Define an Name for the Data Source (e.g. InfluxDB-telegraf) and choose “InfluxDB“as type.
-
The URL is http://localhost:8086 has we have installed the InfluxDB locally. And leave “Proxy” as the access type.
-
The telegraf agent will automatically create the data base “telegraf”. So enter “telegraf” as Database name. At user ans password enter anything random. (InfluxDB does not need any credentials by default but the Grafana interface wants you to enter something otherwise you can not save the data source)
-
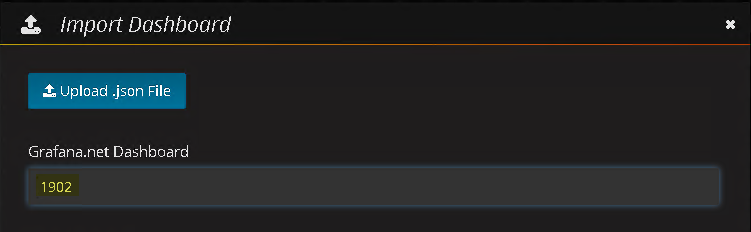
Now go ahead and import your first dashboard. Select Dashboard > Import in the menu.
-
Enter “1902” and click on “Load”
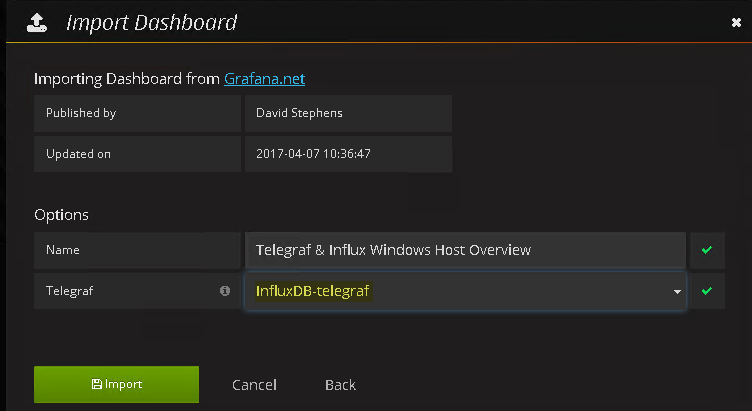
-
Change the Name if you like and select the data source just created in the step above (InfluxDB-telegraf) and then click on Import.
And tada! 😁
Further steps
Now the Telegraf / InfluxDB setup is collecting performance data of your windows machines. With Grafana the collected data can visualized in a meaningful way so the determination of the health of your system gets easy.
To further customize the data and visualization to your specific needs you can:
- Add further perfmon counters to collect to the telegraf agent configuration file
- For more information, consult the official telegraf documentation on GitHub: https://github.com/influxdata/telegraf/tree/master/plugins/inputs/win_perf_counters
- Create custom graphs and Dashboards in Grafana http://docs.grafana.org/guides/getting_started/#dashboards-panels-rows-the-building-blocks-of-grafana
- Get more pre built dashboards from the community
https://grafana.com/dashboards?dataSource=influxdb&collector=Telegraf


Leave a comment